ArcGIS GeoAnalytics Server 10.9 includes updates, enhancements, and bug fixes.
If you're upgrading to ArcGIS GeoAnalytics Server 10.9, you must reauthorize your software. You can obtain a new license file from My Esri.
New analysis tools
Three new tools are added at the ArcGIS GeoAnalytics Server 10.9 release.
Calculate Motion Statistics
The Calculate Motion Statistics tool enriches your time-enabled point data with statistics such as speed, acceleration, and bearing.
The Calculate Motion Statistics tool can be run through ArcGIS REST API, Map Viewer,ArcGIS Pro, and ArcGIS API for Python
Trace Proximity Events
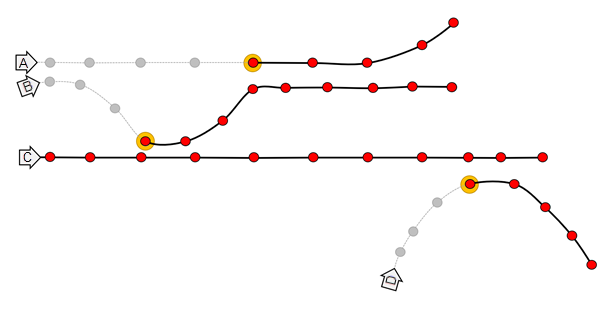
The Trace Proximity Events tool analyzes time-enabled point features representing moving entities. The tool will follow entities of interest in space (location) and time to see which other entities the entities of interest have interacted with. The trace will continue from entity to entity to a configurable maximum degrees of separation from the original entity of interest.

For example, suppose an organization monitors company-issued devices carried by workers. The company is interested in determining which employees were near an individual known to have coronavirus disease 2019 (COVID-19). Using the point layer representing device locations and time, they can identify devices that have been within 6 meters and 5 minutes of the contagious person and other possibly contagious employees.
As another example, an NGO is monitoring salmon populations using GPS and is interested in tracking the spread of salmon lice between escaped farmed salmon and wild populations. Some GPS-tagged farmed salmon were tracked to see whether they come in close proximity with tagged wild populations, and how those wild populations may further spread the disease.
The Trace Proximity Events tool can be run through ArcGIS REST API, Map Viewer,ArcGIS Pro, and ArcGIS API for Python
Summarize Center and Dispersion
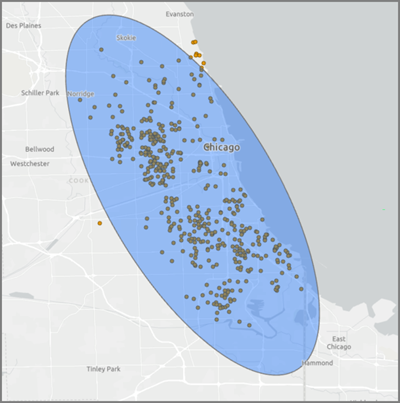
The Summarize Center and Dispersion tool can be used to find central features, directional distributions, and calculates mean and median locations from your point data.

The Summarize Center and Dispersion tool can be run through ArcGIS REST API, ArcGIS Pro, and ArcGIS API for Python.
Tool enhancements
New Arcade expressions to calculate speed, acceleration, and distance on tracks are available in the following tools: Reconstruct Tracks, Calculate Field, and Detect Incidents.
Reconstruct Tracks—Options have been added for how to represent split tracks, including the option to use an Arcade expression. You can determine how tracks are drawn and summarized using the split type parameter.
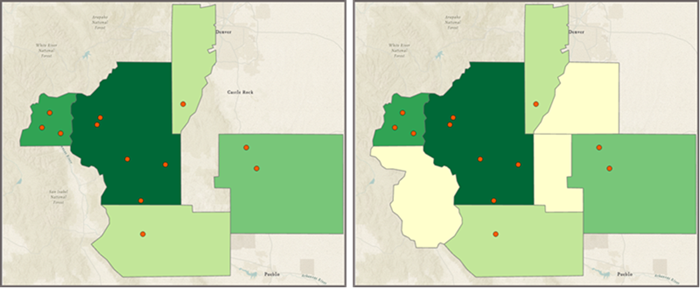
Join Features—An option has been added to keep all target features (known as an outer left join).
Summarize Attributes—You can now apply time stepping to summarized results.